PASTA Threat Modeling Example
Walking a Banking API Through All Seven Stages
Date
Authors
Tony UcedaVélez
Follow Us


Tony UcedaVélez, Founder & CEO, VerSprite; co-creator of PASTA
Abstract
Most published PASTA material explains what each stage is for. Far less of it shows what each stage actually produces. This post takes one realistic system, a retail bank’s payments API, through all seven stages of PASTA (Process for Attack Simulation and Threat Analysis) and shows the artifact each stage hands to the next: a business objectives table, a technical scope inventory, a data-flow diagram, a threat list, a vulnerability map, an attack tree and a risk-ranked countermeasure register. The system, its findings and its dollar figures are a composite built for illustration, but every weakness in it is one we routinely find in real financial-services engagements. The most useful result is not any single finding. It is that the countermeasure the team would have funded first on instinct ranked last once Stage 7 put numbers on it. A fill-in version of every artifact is available as a downloadable PASTA threat modeling template.
1. The System: Ledgerline Payments API
Ledgerline is a fictional mid-size U.S. retail bank. Its Payments API serves two kinds of clients:
- Its own mobile app, used by retail customers to check balances and send person-to-person transfers.
- Licensed third-party aggregators (TPPs) that read account data and initiate payments on a customer’s behalf after the customer grants consent.
The API runs on Kubernetes in a public cloud and reaches the bank’s on-premises core ledger through an enterprise service bus. That split, a modern cloud edge bolted onto a decades-old system of record, is typical of the banks we work with and is where several of the findings below come from.
The trigger for the threat model was a product decision: raise the per-transfer limit for aggregator-initiated payments from $2,500 to $25,000. Nothing in the architecture changed. The value at risk did.
2. Stage 1 — Define Objectives
Stage 1 asks what the business is trying to achieve and what it cannot afford to lose. Security objectives are derived from those answers, not from a control catalog.
Artifact 1: Business and security objectives
| ID | Business objective | Derived security objective | Impact tolerance |
|---|---|---|---|
| BO-1 | Grow aggregator-initiated payment volume after the limit increase | Only the account owner, or a TPP holding valid, unexpired, correctly scoped consent, can move funds | Direct fraud loss under 2 bps of monthly transfer volume |
| BO-2 | Keep the mobile app the primary channel for retail customers | Account takeover must not convert into money movement without a second, independent signal | No more than 1 confirmed ATO-driven loss per 100,000 active users per quarter |
| BO-3 | Meet regulatory obligations (GLBA Safeguards Rule, FFIEC authentication guidance, PCI DSS where card data is touched) | Customer financial data is confidential in transit, at rest and in logs | Zero reportable data-exposure events |
| BO-4 | Maintain availability commitments to TPP partners | Payments API resists volumetric and application-layer exhaustion | 99.95% monthly availability |
Two things are worth noting. First, the impact tolerances are numbers the business signed off on, not numbers security invented. Getting them took two meetings and a draft that the CFO’s office rejected. Second, BO-1 is the reason the model exists. Every later stage gets judged partly by whether it says something about the limit increase.
3. Stage 2 — Define Technical Scope
Stage 2 inventories what is in play: components, dependencies, protocols, and third parties. Its job is to stop the model from quietly excluding the part of the system nobody wants to talk about.
Artifact 2: Technical scope inventory
| Component | Technology | In scope | Notes |
|---|---|---|---|
| API gateway + WAF | Managed gateway, cloud WAF | Yes | Terminates TLS and mTLS; validates token signature and scope |
| Authorization server | OAuth 2.0 / OIDC | Yes | Issues customer and TPP tokens; stores consents |
| Accounts service | Java, Kubernetes | Yes | Read-only balance and transaction queries |
| Transfers service | Go, Kubernetes | Yes | Creates transfers; enforces limits |
| Fraud scoring service | Internal ML model | Yes | Synchronous score on every transfer |
| Event bus | Kafka | Yes | Transfer events, seven-day retention |
| Ledger cache | PostgreSQL | Yes | Read replica of core balances |
| ESB adapter + core ledger | On-premises | Yes, interfaces only | Core internals covered by a separate model |
| SMS / push OTP provider | Third party | Yes, as a dependency | Vendor security assessed separately |
| Legacy /v1/login endpoint | Monolith route | Yes | Still serves an older app version |
The last row was not on the architecture team’s original list. It surfaced when we compared gateway route tables against the documented API surface. Roughly 4% of mobile sessions still authenticated through it. It becomes important in Stage 5.
4. Stage 3 — Application Decomposition
Stage 3 breaks the system into actors, data flows, data stores, and trust boundaries. The data-flow diagram (DFD) is the central artifact, and every threat and vulnerability later in the model is pinned to a numbered flow or store on it.
Artifact 3: Data-flow diagram
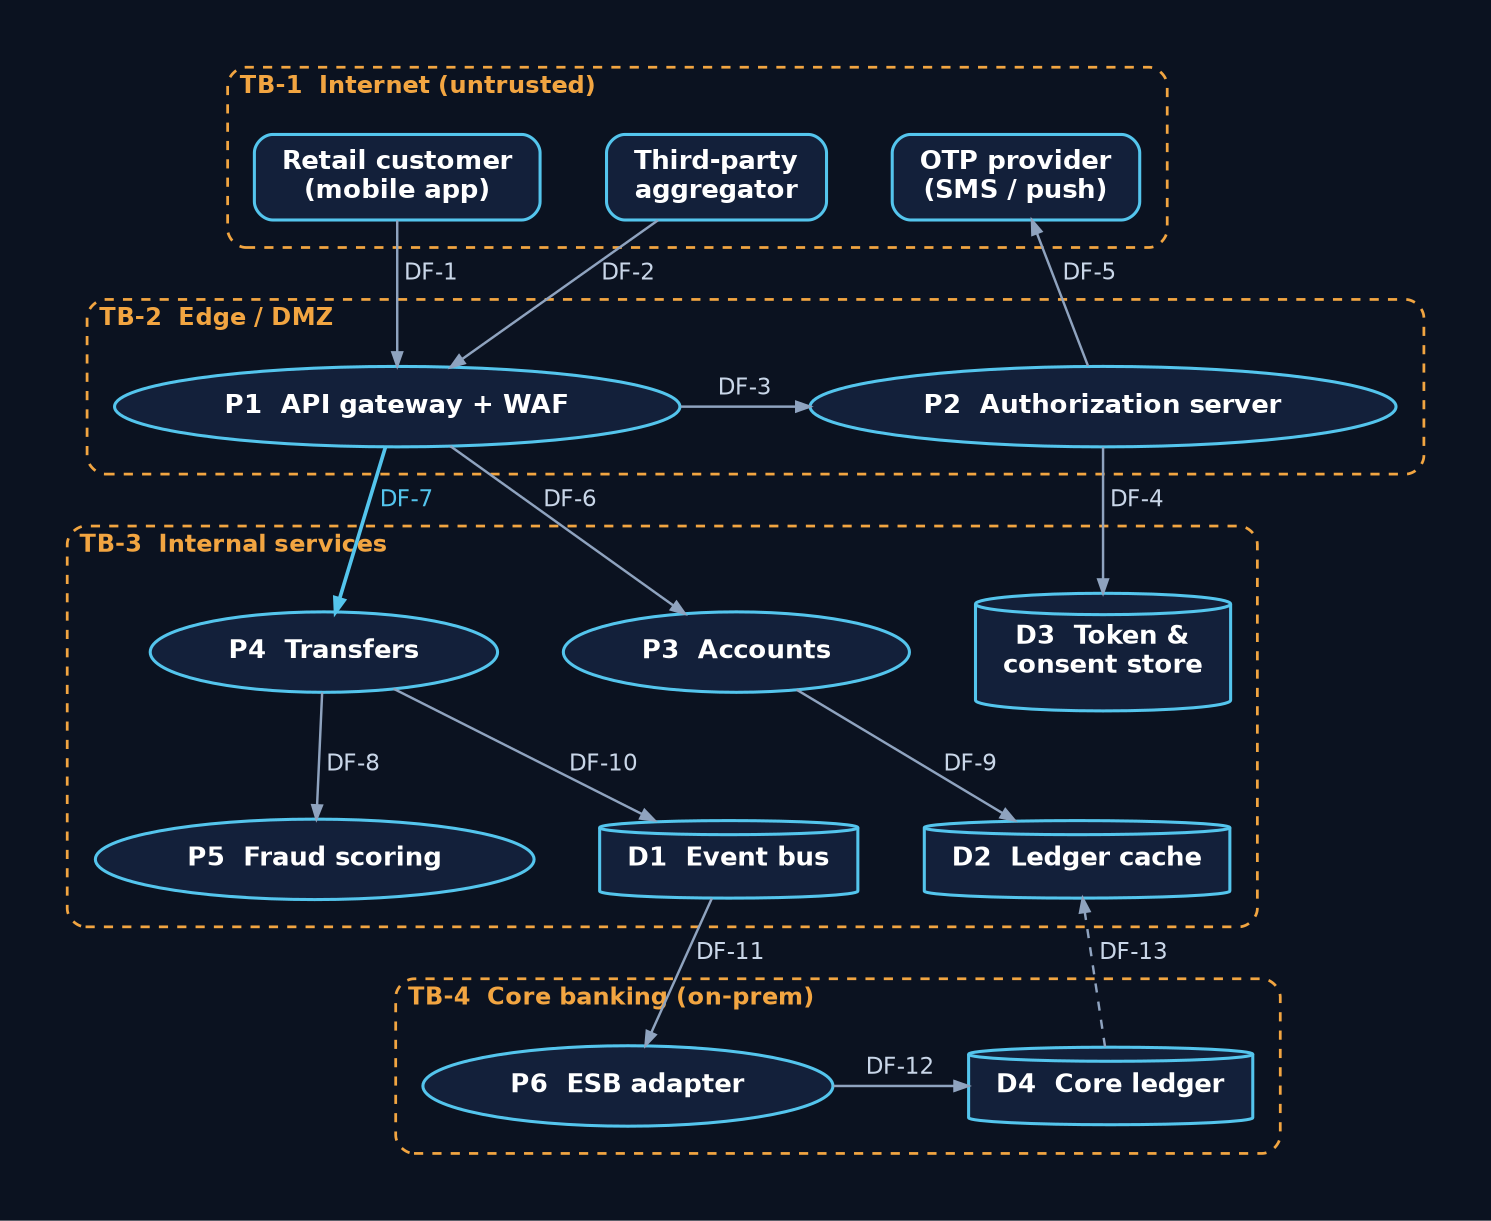
The diagram shows four trust boundaries: the internet (TB-1), the edge (TB-2), internal services (TB-3), and on-premises core banking (TB-4). The flows that cross a boundary carry most of the risk:
- DF-1 and DF-2 cross from untrusted clients into the gateway. All authentication and consent decisions start here.
- DF-7 carries transfer creation from the gateway into the Transfers service. The gateway checks that a token is valid and has the
paymentsscope. As Stage 5 shows, it does not check whose account the token is allowed to debit. - DF-11 and DF-12 cross into the core. The ESB trusts anything on the event bus, so the event bus is effectively part of the core’s trust boundary whether or not anyone drew it that way.
Decomposition also produced the actor and role list (retail customer, TPP, fraud analyst, operations staff with manual posting rights, service accounts) and the use cases each actor is entitled to. The template includes both.
5. Stage 4 — Threat Analysis
Stage 4 asks who would attack this system, why, and how, drawing on threat intelligence rather than a generic category list. For Ledgerline, we used three inputs: the bank’s own fraud case data from the prior 12 months, MITRE ATT&CK technique mappings for the actor types the fraud team actually sees, and the OWASP API Security Top 10 (2023) for API-specific abuse.
Artifact 4: Threat list
| ID | Threat | Likely actor | Target flow / store | ATT&CK / OWASP reference |
|---|---|---|---|---|
| T-01 | Account takeover by credential stuffing | Organized fraud rings | DF-1 | T1110.004 Credential Stuffing; T1078 Valid Accounts |
| T-02 | Moving funds from an account the caller does not own | Authenticated customer or compromised account | DF-7 | OWASP API1:2023 Broken Object Level Authorization |
| T-03 | Theft and replay of a TPP’s tokens | Attacker who has breached an aggregator | DF-2, D3 | T1528 Steal Application Access Token; T1550.001 Application Access Token |
| T-04 | Interception of SMS one-time passcodes via SIM swap | Fraud rings with telecom insiders or social engineers | DF-5 | T1111 Multi-Factor Authentication Interception |
| T-05 | Authorized push-payment fraud (customer is tricked into sending) | Scam operations | DF-7 | T1657 Financial Theft |
| T-06 | Business-logic abuse of transfer limits | Authenticated attacker | DF-7, D2 | OWASP API6:2023 Unrestricted Access to Sensitive Business Flows |
| T-07 | Unauthorized manual postings by an insider | Operations staff | DF-12, D4 | T1078 Valid Accounts; T1565.001 Stored Data Manipulation |
| T-08 | Exposure of account data in event streams or logs | Any party with log or bus access | D1 | No clean ATT&CK mapping; treated as a data-handling threat |
| T-09 | Application-layer exhaustion of the transfer endpoint | Extortion or hacktivist actors | DF-1, DF-2 | T1499.003 Application Exhaustion Flood |
T-05 is uncomfortable because the attacker never touches the API. It stays in the model because it is the largest category in Ledgerline’s own fraud data, and a threat model that only counts technical intrusion would have dropped the bank’s most frequent loss.
6. Stage 5 — Vulnerability and Weakness Analysis
Stage 5 asks which threats have something to work with. Each weakness is mapped back to a Stage 4 threat and a Stage 3 flow, and each carries the evidence that produced it. A weakness with no threat attached is a finding for a backlog; a weakness that enables a listed threat is a finding for this model.
Artifact 5: Vulnerability mapping
| ID | Weakness | CWE | Enables | Location | Evidence source | Status |
|---|---|---|---|---|---|---|
| V-01 | Transfers service trusts sourceAccountId from the request body without checking it belongs to the token’s subject | CWE-639 | T-02 | DF-7 / P4 | Manual API testing | Confirmed |
| V-02 | Legacy /v1/login has no rate limiting or bot detection | CWE-307 | T-01 | DF-1 | Gateway config review, DAST | Confirmed |
| V-03 | Transfers to existing payees require no step-up authentication | Design weakness; no CWE fits cleanly | T-01, T-04 | DF-7 | Architecture review | Confirmed |
| V-04 | Daily limit is checked, then debited, in separate non-atomic operations | CWE-362 | T-06 | P4 / D2 | Code review, load test | Confirmed |
| V-05 | TPP refresh tokens live 90 days and are not sender-constrained | CWE-613 | T-03 | DF-2 / D3 | Authorization server config | Confirmed |
| V-06 | Full account numbers written to transfer events on Kafka | CWE-532 | T-08 | D1 | Topic sampling | Confirmed |
| V-07 | TPP webhook registration accepts arbitrary callback URLs | CWE-918 | T-03 | DF-2 | Manual testing | Not exploitable (egress proxy blocks internal ranges) |
| V-08 | Payee creation accepts a customerId parameter | CWE-639 | T-02 | DF-7 | Manual testing | Not exploitable (server overrides with token subject) |
Two observations. V-03 is a design decision, not a bug, and no scanner would have found it. It only appears when a threat (T-01) is read against the flows it targets. And V-07 and V-08 stay in the table even though they failed. Recording what was tested and ruled out is what lets the next iteration of the model skip that work.
7. Stage 6 — Attack Modeling
Stage 6 tests whether threats and weaknesses actually combine into a working attack. The artifact is an attack tree rooted in the objective an attacker cares about, and the work is attack simulation: trying the branches.
Artifact 6: Attack tree
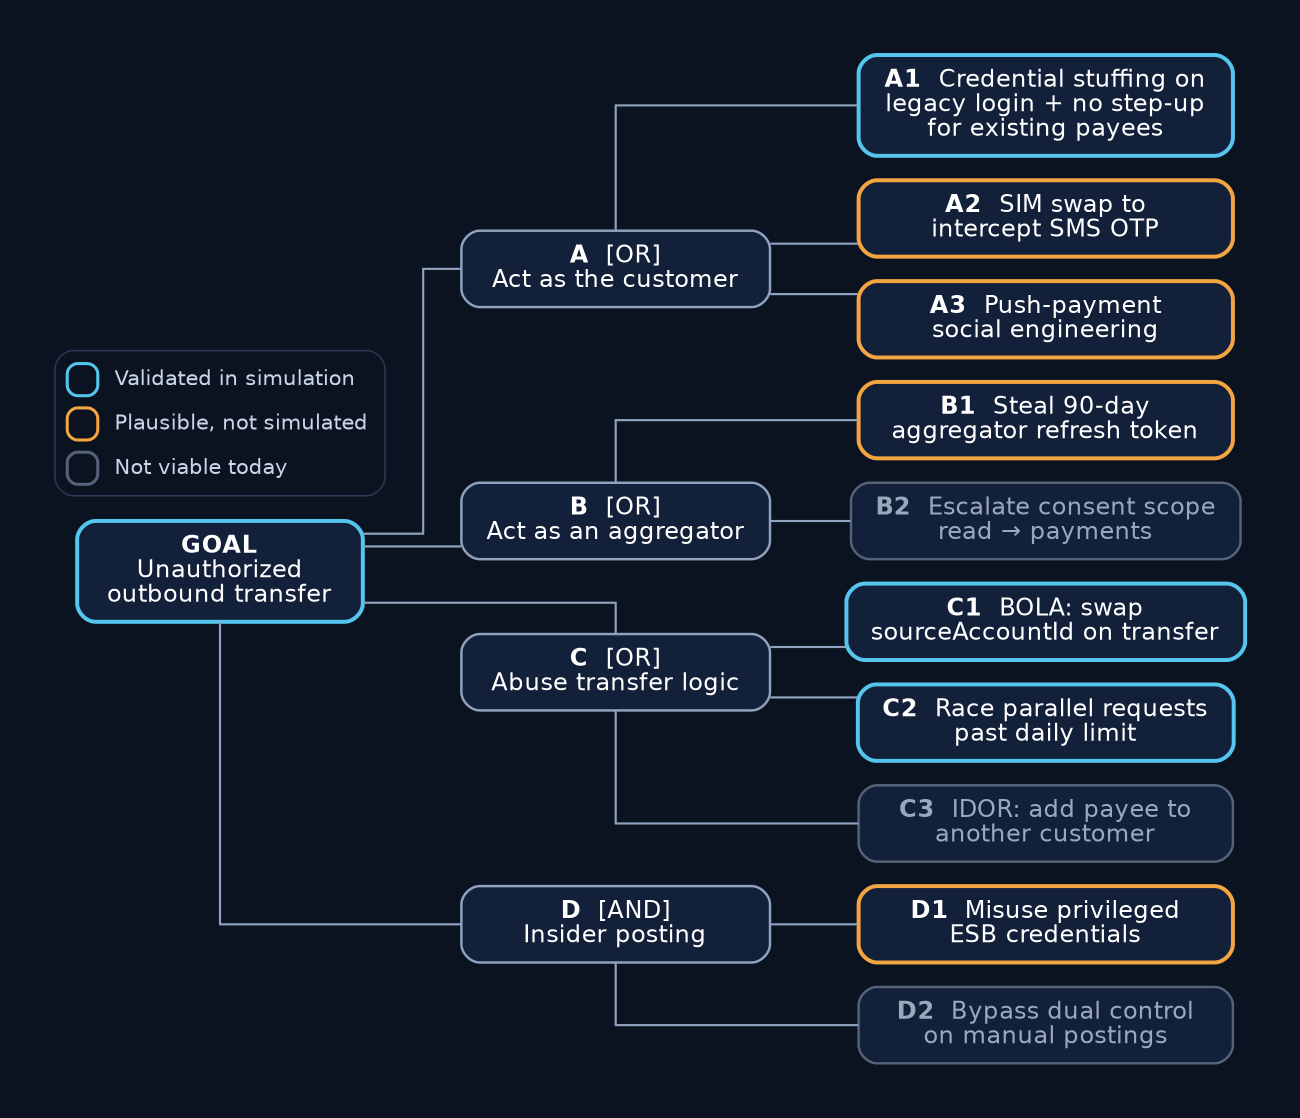
The goal node, an unauthorized outbound transfer, maps directly to the security objective under BO-1. Four branches lead to it:
- A — Act as the customer. A1 chains V-02 and V-03: stuffed credentials through the legacy login, then a transfer to an existing payee with no step-up. We validated this path end to end in the test environment. A2 (SIM swap) and A3 (social engineering) are plausible but were not simulated.
- B — Act as a trusted aggregator. B1 depends on a breach at the aggregator, which we could not simulate, so it is marked plausible. B2 failed: the authorization server correctly refused to widen a consent’s scope.
- C — Abuse transfer logic. C1 (V-01) and C2 (V-04) both worked. C1 is the more serious: any authenticated customer could debit any account by changing one field. C3 failed, as V-08 predicted.
- D — Insider posting. An AND node. Misusing ESB credentials is plausible, but bypassing dual control on manual postings was not, so the branch as a whole is not viable today.
The limit increase that triggered the model matters most on branch C. C1 works with any token that carries the DF-7 and carries transfer creation from the gateway into the Transfers service. The gateway checks that a token is valid and has the payments scope. As Stage 5 shows, it does not check whose account the token is allowed to debit.scope, including an aggregator’s. Before the change, an aggregator-initiated C1 request was capped at $2,500. After it, a single request could move ten times that.
8. Stage 7 — Risk and Impact Analysis
Stage 7 converts viable attack paths into business risk and ranks countermeasures by how much risk they remove for what they cost. We used a simple annualized loss expectancy model: annual rate of occurrence (ARO) times single-loss expectancy (SLE), estimated before and after each countermeasure. A qualitative high/medium/low scale would have been faster, and it would have produced the wrong ranking.
Artifact 7: Risk-ranked countermeasures
| Rank | Attack path | Countermeasure | Inherent ALE | Residual ALE | Risk removed | Est. cost | Return |
|---|---|---|---|---|---|---|---|
| 1 | C1 (V-01) | Enforce object-level authorization in the Transfers service against the token subject; add ownership checks to integration tests | $1,700,000 | $85,000 | $1,615,000 | $40,000 | 40.4x |
| 2 | C2 (V-04) | Idempotency keys plus an atomic limit reservation in the ledger cache | $450,000 | $30,000 | $420,000 | $25,000 | 16.8x |
| 3 | B1 (V-05) | Sender-constrained TPP tokens (mTLS-bound or DPoP), refresh-token rotation, 30-day maximum lifetime | $300,000 | $30,000 | $270,000 | $60,000 | 4.5x |
| 4 | A1 (V-02, V-03) | Retire /v1/login; add rate limiting and bot detection; require step-up for transfers above a threshold or from a new device | $720,000 | $120,000 | $600,000 | $150,000 | 4.0x |
| 5 | T-08 (V-06) | Tokenize account numbers in transfer events; shorten retention | $80,000 | $8,000 | $72,000 | $20,000 | 3.6x |
| 6 | A3 | Confirmation-of-payee check, friction and scam warnings for first-time high-value transfers | $180,000 | $90,000 | $90,000 | $50,000 | 1.8x |
| 7 | A2 | Replace SMS OTP with app-bound push or passkeys | $120,000 | $20,000 | $100,000 | $90,000 | 1.1x |
All figures are illustrative. Inherent ALE = ARO × SLE before the countermeasure; residual ALE uses the post-countermeasure ARO; return = risk removed ÷ cost. The ARO and SLE inputs for each row are in the template.
Ranked by return, the order differs from both the inherent-risk order and the order the team proposed before Stage 7. Before the numbers were in, the consensus first project was replacing SMS OTP, because SIM swap was the attack people had read about most. It ranked seventh. With A1 still open, an attacker does not need to intercept a passcode that is never requested for existing payees, so fixing A2 first would have spent $90,000 to close a door next to an open one.
The register also answered the business question from Stage 1. Ledgerline shipped the aggregator limit increase after countermeasures 1 to 3 were in production, not before.
9. Limitations
This example is cleaner than a real engagement in three ways. The system is a composite, so no single bank’s architecture is exposed, and the findings are more evenly distributed across stages than they usually are. The ARO and SLE estimates rest on judgment informed by fraud data, and two analysts working from the same data would produce different numbers; the ranking is more stable than any individual figure, which is the main thing Stage 7 needs to be. And branches we could not simulate (B1, A2, A3) are carried forward as plausible rather than proven, which means their place in the register is more uncertain than C1’s or C2’s.
The model also has a shelf life. The DFD reflects one release. When the core ledger migrates, or a new aggregator integration pattern is added, Stages 2 and 3 have to be redone and everything after them re-checked.
10. Using the Template
The PASTA threat modeling template has one worksheet per stage, each pre-filled with one row from this Ledgerline example to show the expected level of detail. The Stage 7 risk register calculates inherent ALE, residual ALE, risk removed and return automatically from ARO, SLE, and cost inputs, so the ranking updates as estimates change. For the reasoning behind each stage, see Understanding the 7 Stages of PASTA Threat Modeling.
References
- UcedaVélez, T. and Morana, M. M. Risk Centric Threat Modeling: Process for Attack Simulation and Threat Analysis. Wiley, 2015.
- OWASP Foundation. OWASP API Security Top 10 — 2023.
- The MITRE Corporation. MITRE ATT&CK Enterprise Matrix.
- The MITRE Corporation. Common Weakness Enumeration (CWE).
- OpenID Foundation. FAPI 2.0 Security Profile.
- Federal Financial Institutions Examination Council. Authentication and Access to Financial Institution Services and Systems (2021).
- PCI Security Standards Council. PCI DSS v4.0.
Frequently Asked Questions
A PASTA threat modeling example is a worked walkthrough that takes one real or realistic system through all seven PASTA stages and shows the artifact each stage produces: business objectives, technical scope, a data-flow diagram, a threat list, a vulnerability map, an attack tree and a risk-ranked set of countermeasures.
Define Objectives, Define Technical Scope, Application Decomposition, Threat Analysis, Vulnerability and Weakness Analysis, Attack Modeling, and Risk and Impact Analysis. Each stage's output is the next stage's input.
For a single API with a handful of services, a first pass typically takes two to four weeks of elapsed time. Most of that is waiting on business stakeholders in Stage 1 and architecture owners in Stages 2 and 3, not analysis. Later iterations are much faster because the scope, DFD and ruled-out findings carry over.
You get partial value from partial runs, but the stages are designed to depend on each other. Skipping Stage 1 leaves Stage 7 with nothing to measure impact against, and skipping Stage 6 means risk is assigned to weaknesses nobody has shown can be exploited.
STRIDE classifies threats by category against each element of a diagram. PASTA's Stage 4 starts from who is likely to attack the system and how, using threat intelligence and the organization's own incident data, and then pins those threats to the diagram. The two can be combined; STRIDE is often used as a completeness check inside Stage 4.
An attack tree is the Stage 6 artifact. Its root is an attacker's goal, tied to a Stage 1 business objective, and its branches are the alternative (OR) or combined (AND) steps needed to reach it. Each branch is marked by whether simulation showed it to be viable.
Stage 7 estimates the business impact of each viable attack path before and after a proposed countermeasure, then ranks countermeasures by how much risk they remove relative to their cost. This example uses annualized loss expectancy; other quantitative models work as well, as long as the method is applied consistently.
Download the spreadsheet, replace the example rows on each stage's worksheet with your own system's details, and fill in the ARO, SLE and cost estimates on the Stage 7 sheet. The risk calculations and return figures update automatically.
Share
- /
- /
- /
- /
- /
- /
- /
- /
- /
- /
- /
- /
- /
- /
- /
- /
- /
- /
- /
- /
- /
- /