Advanced Threat Modeling: Methods That Find Real Attack Vectors

Date
Authors
Tony UcedaVélez
Follow Us


Security teams do not generally suffer from a shortage of identified findings; they suffer from an inability to tell, among many findings, which represent credible attack vectors worth acting on. This blog examines that gap empirically, using published vulnerability and exploitation data as a proxy for the broader problem, and then evaluates threat modeling methods by a specific criterion: do they concentrate analysis on paths an adversary would plausibly take, or do they produce a categorized inventory with no inherent signal about which entries matter. Category-based methods such as STRIDE and severity-only scoring such as raw CVSS are found to share the same structural weakness as the CVE ecosystem they resemble. Methods that incorporate correlated threat intelligence and adversarial validation, such as PASTA’s later stages, address that weakness directly. We close by naming where even those methods remain incomplete.
Introduction
A prior paper in this series defined advanced threat modeling by three components: risk-driven analysis, attack surface evaluation, and threat-informed design. This paper takes a narrower slice of that argument and asks a more mechanical question: among specific, named threat modeling methods and techniques, which ones actually surface attack vectors that turn out to be credible, and which ones produce a comprehensive but largely undifferentiated list of theoretical possibilities?
This question has an empirical analogue outside threat modeling proper, in vulnerability management, and it is worth examining that analogue first because the data is unusually clear. Section 2 presents it. Section 3 extends the same logic to severity-based scoring specifically. Section 4 examines category-based threat modeling techniques STRIDE and attack trees against this standard. Section 5 examines methods that incorporate threat intelligence correlation and adversarial validation, using PASTA as the primary example. Section 6 states the limitations of this framing. Section 7 concludes.
The Scale of the Signal-to-Noise Problem
The CVE ecosystem provides the cleanest available illustration of the gap between “identified” and “credible attack vector.” The CVE Program recorded 48,185 new vulnerabilities in 2025, a 20.6 percent increase over 2024’s already-record total. Against that volume, VulnCheck’s 2026 Vulnerability Exploitation In the Wild report found that just 1 percent of vulnerabilities disclosed in 2025 were confirmed to have been exploited in the wild.
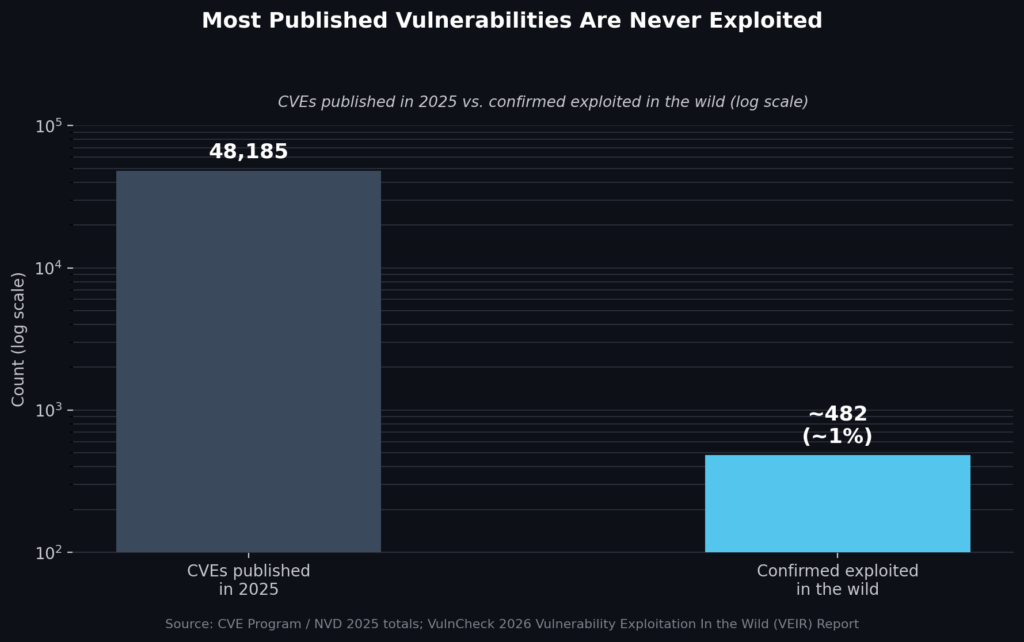
This is not a new finding specific to 2025; earlier analyses by Kenna Security and Cyentia found a comparable sub-2-percent exploitation rate, and FIRST’s own EPSS research has consistently placed the figure under 5 percent across several years of data. The consistency of the finding across years and research groups is itself informative: the gap between identified vulnerability and credible attack vector is not a temporary data quality problem. It is a structural feature of how vulnerabilities are disclosed, which is by the presence of a flaw, not by evidence that an adversary has found the flaw worth using.
Threat modeling faces a structurally identical problem, one level up the stack. A threat model that enumerates every theoretically possible threat against a system is doing the equivalent of publishing every CVE without distinguishing the 1 percent that matter from the 99 percent that don’t. The question this paper is organized around is which threat modeling methods build in a mechanism analogous to exploitation evidence, and which don’t.
Why Severity Scoring Alone Doesn’t Solve It
The vulnerability management field’s first attempt at solving this problem was severity scoring, with CVSS being the dominant example, on the theory that a numeric severity score would let teams triage by impact even without exploitation data. Current data suggests this only partially works. Research from FIRST, the organization that maintains CVSS, found that of vulnerabilities scored 7.0 or higher, the threshold most vulnerability management programs use to define urgent remediation, only about 2.3 percent were observed in active exploitation attempts in a given month. In the other direction, in the first quarter of 2025, 28 percent of vulnerabilities that were actually being exploited carried only a medium CVSS base score, meaning any program that deprioritizes medium-severity findings by default is deprioritizing over a quarter of what attackers are actually using.
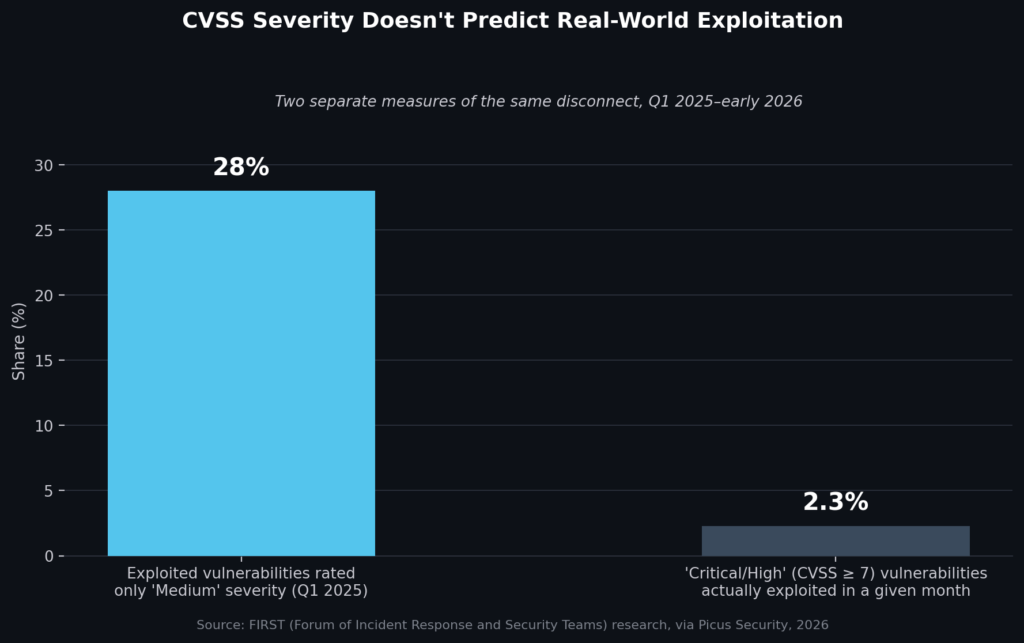
The relevance of this to threat modeling methodology is direct. A threat modeling technique that assigns severity or likelihood scores using a fixed rubric high, medium, low, applied by category rather than by correlation to observed adversary behavior, inherits the same weakness CVSS has. It produces a defensible-looking number that does not reliably track which findings an adversary would actually pursue.
Category-Based Methods: STRIDE and Attack Trees
STRIDE, the most widely taught threat categorization framework, sorts threats into six types: spoofing, tampering, repudiation, information disclosure, denial of service, and elevation of privilege, and is typically applied by walking each system component against each category. This produces a comprehensive inventory of what could theoretically go wrong, organized cleanly. It does not, by itself, produce a ranking of which entries in that inventory represent a credible attack vector versus a technically valid but practically irrelevant possibility, for the same reason a raw CVE list doesn’t: categorization and enumeration are not the same operation as correlation against real adversary behavior.
Attack trees improve on this somewhat by structuring threats as a sequence of steps an attacker would need to complete, which at least forces an analyst to reason about feasibility rather than stopping at “this category of thing could happen.” But an attack tree’s branches are only as credible as the assumptions behind them, and without a step that checks those assumptions against observed attacker behavior which techniques are actually used, in which sequence, against comparable systems an attack tree can be internally consistent and still describe a path no real adversary has taken or would take.
Neither STRIDE nor attack trees are wrong to use. Both remain reasonable starting points for structuring an analysis. The specific limitation, consistent with Section 3’s argument about CVSS, is that neither method has a built-in mechanism for distinguishing a theoretically valid finding from a credible one. That mechanism has to come from somewhere else.
Methods That Incorporate Correlation and Validation
PASTA (Process for Attack Simulation and Threat Analysis), the seven-stage methodology developed by VerSprite founder Tony UcedaVélez and Marco M. Morana, addresses this gap in two of its later stages specifically. Its threat analysis stage requires correlating real threat intelligence and observed adversary behavior, not a generic category list, against the specific system under review, which is analogous to checking a theoretical vulnerability against an exploitation database before treating it as urgent. Its attack modeling stage goes further, requiring that candidate attack paths be built out as concrete scenarios and, in the strongest implementations, tested through simulation or adversarial validation rather than left as a diagram.
This second step is the closer analogue to what the CVE data in Sections 2 and 3 actually measures: not “is this theoretically possible” but “has something resembling this been demonstrated to work.” A threat modeling practice that stops at categorization is publishing the equivalent of the full CVE list. A practice that correlates against real threat intelligence is applying something like a severity filter. A practice that validates candidate attack paths through simulation or red-team testing is doing the closest available analogue to checking a CVE against an exploitation database directly, which the data in this paper suggests is the step that actually separates credible attack vectors from theoretical ones.
Frameworks that incorporate structured adversary-behavior data, such as MITRE ATT&CK-informed modeling, serve a similar correlating function when used to check whether a hypothesized attack path maps to techniques actually observed in comparable environments, rather than techniques that are merely categorically possible.
Limitations and Open Questions
This argument has real boundaries.
First, exploitation-rate data of the kind presented in Sections 2 and 3 reflects global base rates across all disclosed vulnerabilities, not the specific exposure of any one organization’s environment. A vulnerability with a low global exploitation probability can still be a credible, high-priority attack vector for a specific organization if that organization’s exposure, asset value, or threat actor profile makes it more attractive than the global average suggests. The same caution applies to threat modeling: a method that filters for “what’s typically credible” can systematically underweight a threat that is unlikely in general but specifically plausible against this system.
Second, optimizing a threat model for likely, well-precedented attack paths risks a form of survivorship bias: rare, novel, or catastrophic attack vectors are by definition underrepresented in historical correlation data, precisely because they haven’t happened often, or happened at all, yet. A methodology that leans too heavily on “what’s been observed before” can miss the attack path that hasn’t been observed because no one has tried it yet, which is a real risk for organizations facing sophisticated or first-mover adversaries.
Third, adversarial validation, the step this paper identifies as the strongest available filter for credibility, is resource-intensive and cannot be applied exhaustively to every theoretical finding a categorization exercise produces. Some triage has to happen before validation, using exactly the kind of severity or category judgment Sections 3 and 4 identify as imperfect. The methods described in Section 5 do not eliminate this bootstrapping problem; they narrow it.
Fourth, the analogy this paper draws between CVE exploitation data and threat modeling credibility is a structural analogy, not a demonstrated empirical equivalence. No dataset cited here directly measures the accuracy of threat modeling methods against confirmed real-world attack paths in the way EPSS and KEV data measure CVE exploitation. The argument should be read as reasoning by structural analogy, not as a claim that threat modeling has its own equivalent, validated EPSS score.
Conclusion
The gap between an identified finding and a credible attack vector is large and well documented in vulnerability management, where fewer than 5 percent of disclosed CVEs, and as few as 1 percent in a given year, are ever confirmed exploited. Threat modeling methods that stop at categorization or apply fixed severity rubrics STRIDE without a correlation step, or CVSS without exploitation context, inherit a structurally similar gap. Methods that incorporate real threat intelligence correlation and adversarial validation, which later-stage PASTA analysis is built around, address that gap directly rather than incidentally. They do not close it entirely: global exploitation data doesn’t capture organization-specific exposure, correlation to historical behavior can underweight novel attack paths, and validation remains too resource-intensive to apply to every theoretical finding a broad categorization exercise generates.
References
- CVE Program / NVD. 2025 CVE publication totals.
- VulnCheck. 2026 Vulnerability Exploitation In the Wild (VEIR) Report.
- FIRST (Forum of Incident Response and Security Teams). EPSS research and CVSS guidance, as reported via Picus Security, Vulnerability Prioritization in 2026: Why CVSS Isn’t Enough.
- Kenna Security / Cyentia Institute. Prioritization to Prediction, Volume 1.
- UcedaVélez, T., and Morana, M.M. Risk Centric Threat Modeling: Process for Attack Simulation and Threat Analysis. Wiley, 2015.
