Windows Userland Application Attack Surface Enumeration

Introduction to Identifying a Userland Application’s Attack Surface on Windows
Inside the domain of vulnerability research, many different methodologies exist for how a researcher may start their journey with auditing an application. This blog provides information on how to enumerate the attack surface of userland applications that are deployed on the Windows operating system.
The purpose of attack surface enumeration is to gather specific data about a targeted application. Accompanying information such as examples and tool usage are also showcased to aid the reader.
What & Why is Attack Surface Enumeration Important
The point of attack surface enumeration is to identify all paths where user-controlled data affects an application.
Given that not every application is going to be the same, the attack surface is dependent on what functionality and technologies an application utilizes. Failure to perform proper enumeration can result in an incomplete map of the attack surface.
Understanding What to Look For
There are many different attack vectors that are specific to each environment such as permissions on local resources, how an application communicates with a service, and the privilege level of a service or application.
During attack surface enumeration, we are not only interested in the data that is operated on, but also how the application uses the data.
Getting Down with File Formats
The file format of an application is a crucial part in the attack surface enumeration phase, so it is essential to know that each file type has a predefined format.
The specifications for these formats are available online and can offer insight into the data and its purpose within a file.
For example, refer to Figure 1 depicting a Windows PE binary in a hex editor.
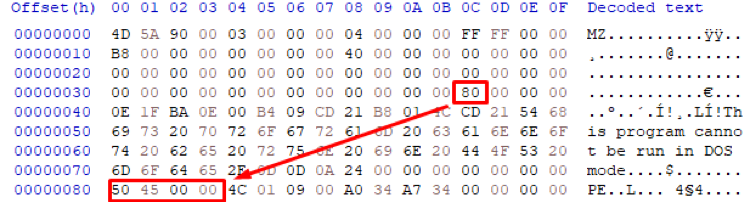
Figure 1 – View of PE file in a hex editor
The value at offset 0x3C is an offset that points to the location of the PE file signature within a PE binary.
As seen above, the value at offset 0x80 is “0x50450000″, showing that this is in fact a PE binary. Most of the applications we will come across on Windows are either C, C++, or .NET. However, these are not the only ones. Now that we have talked about file formats, let’s review identifying resource permissions.
Permissions You Say?
Permissions are a core component of operating systems and are implemented in many ways.
When it comes to the Windows operating system, permissions are assigned using Access Control Lists (ACL). ACL’s are composed of Access Control Entries (ACE’s) which hold two separate permission structures.
The first is a Discretionary Access Control List (DACL) and the second is a System Access Control List (SACL). The DACL is the one we are most interested in since it defines who can access a specified resource to modify, write, read, or execute respectively. The SACL, on the other hand, is for logging purposes for the security event log.
To view the DACLs of a given resource, we can use the tool icacls from the Windows command line.
C:Program Files NT SERVICETrustedInstaller:(F) NT SERVICETrustedInstaller:(CI)(IO)(F)
NT AUTHORITYSYSTEM:(M)
NT AUTHORITYSYSTEM:(OI)(CI)(IO)(F)
BUILTINAdministrators:(M)
BUILTINAdministrators:(OI)(CI)(IO)(F)
BUILTINUsers:(RX)
BUILTINUsers:(OI)(CI)(IO)(GR,GE)
CREATOR OWNER:(OI)(CI)(IO)(F)
APPLICATION PACKAGE AUTHORITYALL APPLICATION PACKAGES:(RX)
APPLICATION PACKAGE AUTHORITYALL APPLICATION PACKAGES:(OI)(CI)(IO)(GR,GE)
APPLICATION PACKAGE AUTHORITYALL RESTRICTED APPLICATION PACKAGES:(RX)
APPLICATION PACKAGE AUTHORITYALL RESTRICTED APPLICATION PACKAGES:(OI)(CI)(IO)(GR,GE)
The tool icacls presents information about both inherited and non-inherited permissions. In Windows, most files and subfolders inherit permissions from the parent folder. The tool AccessEnum from SysInternals Suite is a Graphical User Interface (GUI) program that reports a more easily readable result of DACL’s for a given folder.
It also automatically reports any files or sub-folders that hold different DACL’s than the parent folder that was designated as the entry point to scan.
These are both examples of static analysis tools. For an example of AccessEnum usage, refer to Figure 2.
Next, we will discuss the difference between static and dynamic analysis.
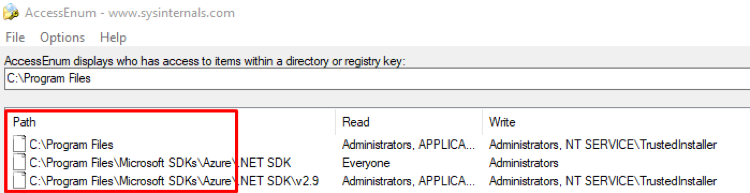
Figure 2 – AccessEnum tool usage
Dynamic vs. Static Analysis
Dynamic analysis provides insight into the functionality of an application while it is running. An example of a dynamic analysis tool is Procmon from SysInternals which is used to view different types of operations performed by an application.
Static analysis provides insight into the base functionality of an application while it is not running. An example of a tool that has functionality to perform static analysis is IDA Pro from Hex-Rays which is capable of disassembling binary applications.
When performing analysis, the usage of both dynamic and static analysis can yield better results for later analysis. Now that we have covered some basic background information, let’s move to the beginning of attack surface enumeration.
What All Is Exposed?
The attack surface for Windows userland applications is massive. Many different functionalities exist that an application may choose to implement.
Throughout the process of attack surface enumeration, we will typically look for the following:
- resource permissions
- active ports
- open handle permissions and types
- implementation of different IPC mechanisms
- process privilege level
- registered services
Each item in the list exposes a fair amount of functionality that an application can utilize. While some functionality is implemented directly like permissions, others like the Clipboard mechanism are not.
Resource Permissions
When enumerating local resources that an application uses, different attack vectors are exposed. These exist because of improper assignment of Windows permissions on local resources. Improper permission assignment can lead to the following attacks.
- DLL hijacking
- Executable hijacking
- Configuration file abuse
- Registry Key abuse
These are just a few examples of the many different types of attacks that can be performed. These attacks are possible because permissions are set for a resource that allow it to be accessed or modified by unintended users.
As an example, we are going to enumerate paths to DLL’s (Dynamic Linked Libraries) that an application loads during runtime and record the permissions assigned to them.
The application we are targeting is Notepad.exe and the first tool we are using is Procmon from SysInternals Suite.
The reason we use Procmon is because of its ability to gather specific data that we are interested in. The way Procmon handles this is through the usage of Filters that are user provided. Each Filter can be broken down into four main columns.
The order of these column names are as follow:
- Column
- Relation
- Value
- Action
We will expand on the values we provide to these columns to build our Filter further on in this section.
Now that we have covered what we want to achieve and how we plan to achieve it, let’s put this into action.
Before starting Notepad.exe open Procmon and access the Filter view. To do this, enter the hotkey Ctrl+L and a window like Figure 3 will be present.
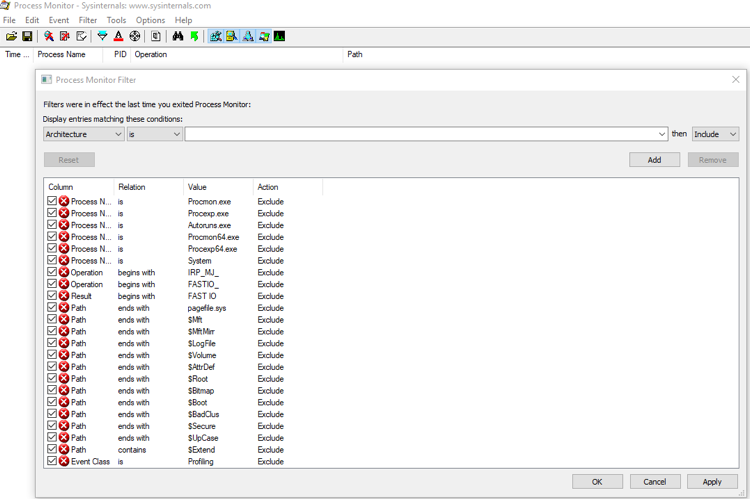
Figure 3 – Procmon Filter window
The type of Filter we are interested in is a Process Name filter.
This filter has a Relation value of contains, Value value of Notepad, and an Action value of Include.
The reason we use contains for the Relation value is because sometimes a process interacts with services that have a similar naming convention.
The next filter we are interested in is an Operation based filter. This filter has a Relation value of is, Value value of Load Image, and Action value of Include.
The reason for Load Image is because Procmon treats any functionality that maps memory inside of a process under this general Column value of Operation.
The created filters should be like Figure 4, given the choice of the value for the Relation column.
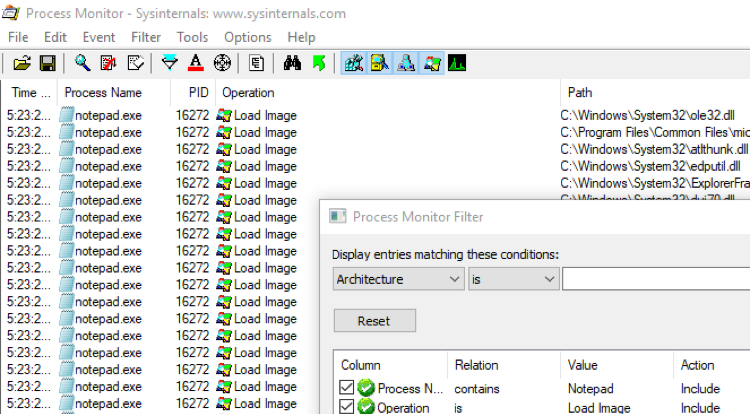
Figure 4 – Creation of specified Procmon Filter
After the creation of these filters, start Notepad.exe and record the unique directories in the Path column.
It is worthwhile to give Procmon ample time to capture all Load Image operations, because some resources take longer to load. The next step is to use AccessEnum to find out the permissions of these different paths.
To perform this action, select the Directory option then navigate to the first path in the list of recorded paths from Procmon and hit scan.
After this, record the results of the different permissions for each file and folder with unique permissions for further analysis. Now that we have finished showcasing dynamic analysis, let’s review the static analysis approach.
Common Windows API functions that handle loading DLL’s into a process’s memory can be seen below:
- LoadLibraryA
- LoadLibraryExA
- LoadLibraryExW
- LoadLibraryW
We can look for these functions inside the import table of an executable using a tool like IDA Pro.
For example, the LoadLibraryA function takes a single argument that can either be the DLL name, the full path including DLL name, or a relative path including the DLL name.
For an example, refer to Figure 5 depicting the identification of the LoadLibraryA and associated functions inside of a binary via the Imports window.
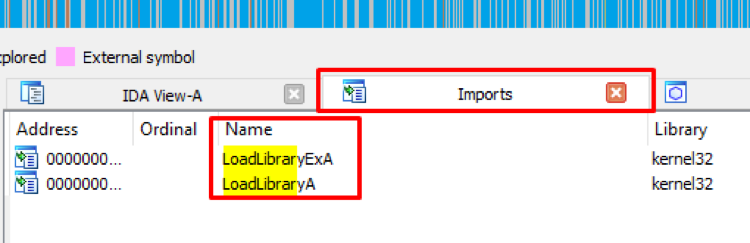
Figure 5 – Identifying LoadLibrary function presence in an application.
Now that we have identified the presence of these functions, the next step is locating calls to them within the application. In order to perform this, double click on a specific function. This will bring us to the idata section within IDA Pro.
The idata section holds information related to functions that an application imports from external resources.
We now should be presented the function location in the idata section within the ‘IDA View-A’ window like Figure 6.
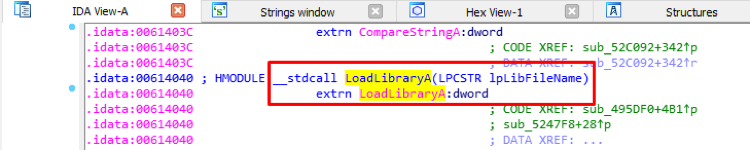
Figure 6 – LoadLibraryA location within the idata memory section
While LoadLibraryA is still highlighted press the hotkey x to open the cross-reference window.
This window is responsible for showcasing all references of calls to this specific function that exist within the application. The current new window should be like Figure 7.
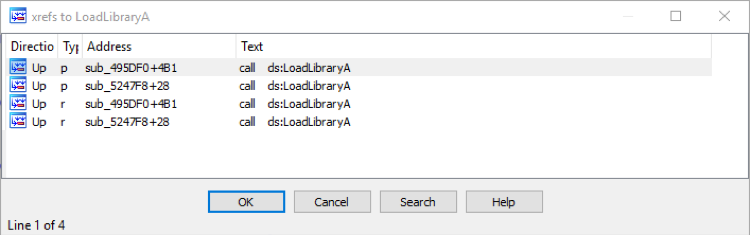
Figure 7 – IDA Pro Cross reference window
Now that we have a list of all calls to this function, the next thing we want to do is record each virtual address in the binary where the calls are made.
To do this, double click on an individual result in the cross-reference window to be taken to the location where the call occurs.
For an example, refer to Figure 8 depicting the location where the specific call occurs.Now that we have covered resource permissions, let us cover identifying active ports.
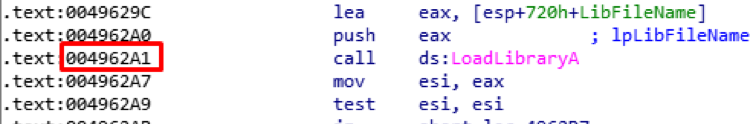
Figure 8 – Virtual address where the call to LoadLibraryA occurs
Active Ports
When enumerating an application, we should identify the presence of networking capabilities. These capabilities can range from a local socket acting as a proxy to the point of establishing remote connections. The reason this is interesting is because it provides immediate insight into the exposed attack surface of an application.
When it comes to identifying these sockets, this can be done either through dynamic or static analysis. We can use the tool TCPView from SysInternals to identify TCP sockets via dynamic analysis.
The tool TCPView provides information for both UDP and TCP endpoints exposed by an application. The information we are interested in is either the presence of Established or Listening connections.
These can be viewed from the results in the State column. The default usage of TCPView is fine for this case and when executed should present a window like Figure 9.
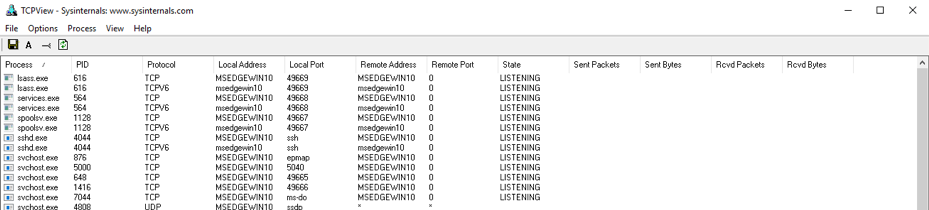
Figure 9 – Example of default usage and output of TCPView
Another method of dynamic analysis could be through the usage of the Procmon tool from SysInternals.
For this scenario, the creation of a Filter for both Process Name and Operation is useful.
However, unlike in previous examples four different Operations are of interest to record. The four operations are TCP Receive, TCP Connect, TCP Send, and TCP Disconnect. These operations will be provided inside of the Value column when building the Filters.
Now that we have covered two examples for dynamic analysis lets cover static analysis.
The desired filter should look like Figure 10, depending on the usage of either is or contains values for the Relation column of the Operation based filter.
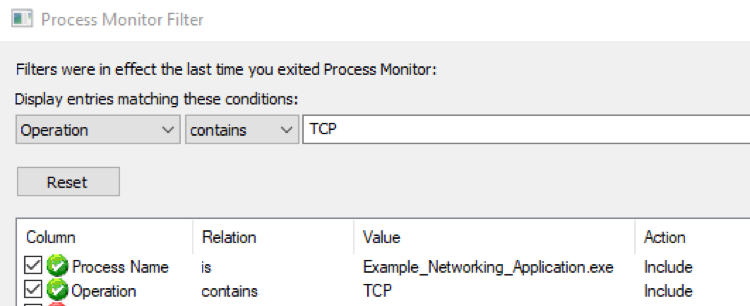
Figure 10 – Desired Filter for capturing TCP based operations an application performs.
For static analysis, we can use IDA Pro to identify functionality associated with both the creation and usage of windows sockets.
The approach can be carried out similarly to how we performed the enumeration of LoadLibrary function usage in a previous section in this blog post.
The list below shows some functions that are associated with Windows networking.
- accept
- AcceptEx
- bind
- connect
- ConnectEx
- listen
- recv
- recvfrom
- RIOReceive
- RIOReceiveEx
- RIOSend
- RIOSendEx
- send
- sendto
- TransmitFile
- TransmitPackets
- WSAAccept
- WSAConnect
- WSAConnectByList
- WSAConnectByName
- WSARecv
- WSARecvEx
- WSARecvFrom
- WSARecvMsg
- WSASend
- WSASendMsg
- WSASendTo
After proper identification of usage, we will record the yielded results for future analysis.
One thing to remember is that the main executable may not handle all functionality on its own. It may have DLL’s or external executables that it allows to handle this functionality instead. When performing the enumeration, make sure to cover all DLL’s or executables that an application uses.
Identify Open Handle Permissions
A handle is used by an application to interact with certain types of data objects. When a data object is requested for use by an application, a specific handle is created and used by the application to reference that specific data object.
Many different types of objects may exist with an open handle. Most of these open handles can be seen by using the tool Procexp from SysInternals.
We will want to start Procexp as an administrator so that it can properly enumerate information it displays.
If we start Procexp as a normal user, we will miss desired information such as type of objects that a handle exists for. In order to view open handles for a given process, we must activate the handle window inside of Procexp.
To do this, go to the top menu item View -> Lower Pane View and select Handle.
Now whenever we select a process, the lower pane will populate with information about open handles. For an example, refer to Figure 11 depicting open handles of the Section object type.
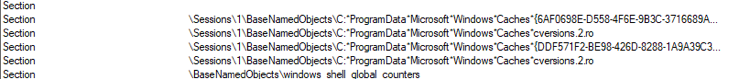
Figure 11 – Open handles to Section objects
From the list of open handles, right click on a specific handle then go to properties. From that point, we can view the security details and see the permissions assigned to each open handle. When recording this data, we must take note of the permissions assigned and the type of object the handle is for.
Identifying Implementations of Different IPC Mechanisms
When it comes to the implementations of Inter-Process Communication (IPC), Windows supports quite a few different mechanisms to achieve this depending on the desired functionality.
The majority of these can be identified statically quite quickly, so that is how we are going to approach this.
| Mechanisms |
|---|
| COM |
| Data Copy |
| DDE |
| File Mapping |
| Pipes |
| RPC |
Each of these provided mechanisms can be identified via static analysis using a tool such as IDA Pro. The same methods described earlier in this blog post on usage of IDA Pro can be used similarly here.
For each mechanism, we have a list of functions associated to identify in an application.
| COM |
|---|
| CoCreateInstance |
| CoCreateInstanceEx |
| CoGetClassObject |
| CoCreateInstanceFromApp |
| Data Copy |
|---|
| GetMessage |
| DDE |
|---|
| DdeAccessData |
| DdeAddData |
| DdeCallBack |
| DdeConnect |
| DdeCreateDataHandle |
| DdeGetData |
| DdeInitalizeA |
| DdeInitializeW |
| DdeNameService |
| File Mapping |
|---|
| CreateFileMapping |
| OpenFileMapping |
| MapViewOfFile |
| MapViewOfFileEx |
| FlushViewOfFile |
| Pipes |
|---|
| CallNamedPipe |
| ConnectNamedPipe |
| PeekNamedPipe |
| CreateNamedPipe |
| WaitNamedPipe |
| RPC |
|---|
| RpcAsyncInitializeHandle |
| RpcBindingBind |
| RpcEpRegister |
| RpcEpRegisterNoReplace |
| RpcMgmtSetAuthorizationFn |
| RpcNsMgmtEntryCreate |
| RpcMgmtSetAuthorizationFn |
| RpcServerListen |
| RpcServerRegisterIf |
| RpcServerRegisterIf2 |
| RpcServerRegisterIf3 |
| RpcServerRegisterIfEx |
After identifying what mechanisms are exposed, record the yielded output for later analysis.
Identify Process Privilege Level
Whenever performing attack surface enumeration, it is essential to identify the level of privilege a given process has.
The way to accomplish this task is with Procexp like before, however, this time we are going to change the type of column names displayed.
To do this, we Right+Click on the Column names to bring up an option called Select Columns.... The current view should be like Figure 12, depicting the Select Columns... option.
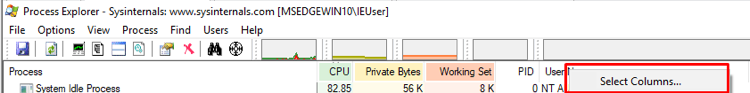
Figure 12 – How to access the window responsible for modifying displayed columns
Then we select the Process Image tab and make sure to tick the box in the User Name option. Now we have a new User Name column, and this is the user privilege that the process has.
For an example, refer to Figure 13 depicting the desired output inside of Procexp.
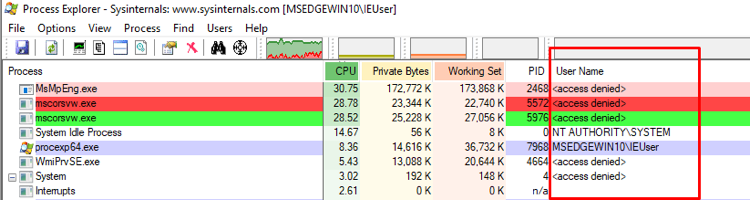
Figure 13 – Desired output of processes privilege level
The results of <access denied> is caused by the privilege level that Procexp is currently running as. In order to fix this issue, start Procexp as an administrator. Now that we can easily identify the privilege level of a given process, we will want to record this data for later analysis.
Identifying Registered Services
The process of identifying what services an application installs can be performed using a tool called PsService from SysInternals Suite.
The output from PsService can be hard to view in command prompt, so instead we can redirect the output to a file for analysis.
First, create a list of currently installed services by executing PsService, then after installing an application execute PsService again to record newly created services.
For an example of default usage, refer to the Figure 14.
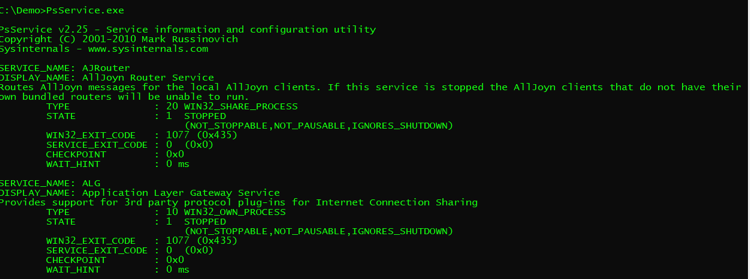
Figure 14 – PsService Example Usage
Final Thoughts
While Windows is quite complex and has many different aspects to think of when trying to cover attack surface enumeration, this post hopefully provided insight into the more prominent aspects.
With the usage of this general approach one can map out the attack surface of Windows userland based applications.
It is important to remember that the purpose of attack surface enumeration is to gather as much information about our target. Think of it like reconnaissance; the impact of the information we gain directly affects the outcome of future attacks.
If you’d like to read more about Windows vulnerabilities, you can also read our post on Abusing Insecure WCF Endpoints here.